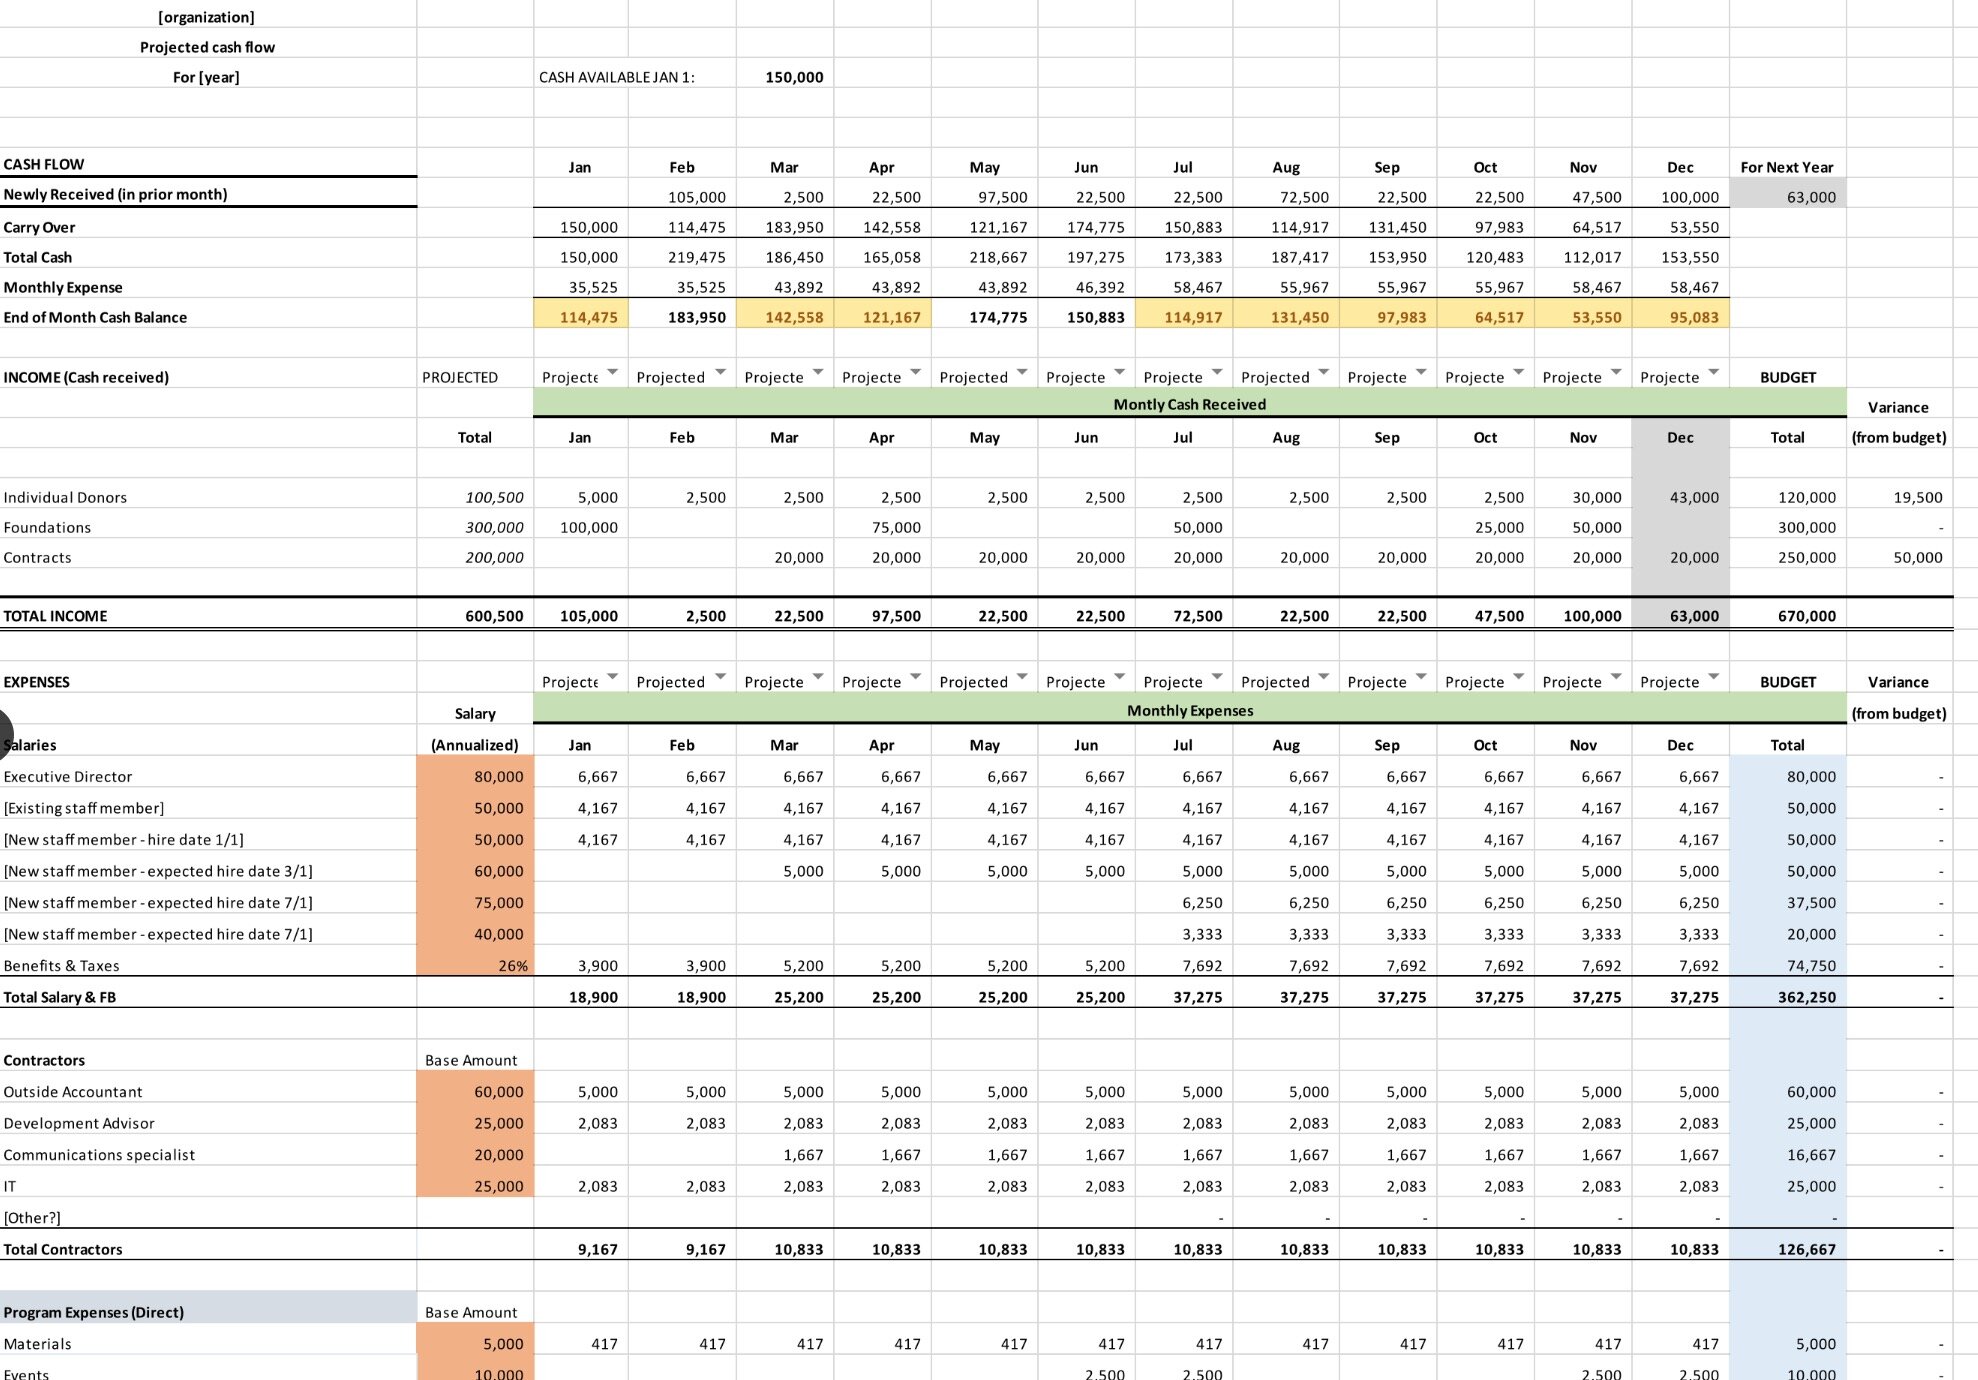
Model Cash Flow Projection (Free Download)
Here are a few of the most important features of the model Monthly Cash Flow Projection:
Cash Balance. The fundamental purpose of the MCFP is to track the End Of The Month Cash Balance (Row 11). Conditional formatting in Row 11 (the yellow shaded cells) can be used to show when this number falls below a designated amount. For the example, that amount is 3 months of operating expenses (cell 061 divided by 4), but set it at whatever amount is appropriate for your organization.
Cash Available Jan 1. The amount of cash available at the beginning of the year (cell E3, which value is pasted to cell C8) is crucial to your ability to spend, particularly early in the year before significant revenue is received. What you choose to count as “available cash” may be complicated by reserve requirements and restrictions on funds.
New revenue (Row 7) is recorded on the MCFP in the month AFTER it is received. Money that comes in throughout January, for example, appears as new income in February. This ensures that funds are actually available to pay expenses.
December Revenue. Cash predicted to be received in December (Column N) does not help in the current year cash flow (which is why it’s grayed out). That revenue will then be a substantial component of Cash Available Jan 1 in the following year.
Total projected income (Cell B21) will not match Budgeted revenue (Cell O21) if your budget is developed using accrual accounting since:
Some income pledged or earned (and recognized) in the prior year will be received in the current year.
Some income recognized (and in your budget) for the current year, either pledged or earned, will not be received until the next year.
Income Categories. The three income rows (Rows 17 – 19) are just examples. Use rows that match your budgeted income categories.
Expenses. For most nonprofits, using accrued expenses (rather than cash) will make it much easier to use this sheet without significantly impacting the results. This will line up your expense estimates and actuals with your budget and financial reporting.
Putting amounts for expense rows in Column B will populate each month with 1/12 of the total amount. This is for your convenience and the sheet will work fine if you leave these amounts out and populate the monthly cells manually.
Adjust projections regularly.
After a month is complete and financial data (even preliminary data) becomes available, replace the projections with the actual amounts of cash received and expenses paid out. Columns labeled as “Projected” should be changed to “Actual” as soon as results are available. Again, if you have an accrual-based accounting system, consider just plugging in the reported numbers rather than converting these to cash basis.
Projections for remaining months in the year should be reviewed regularly and adjusted whenever new assumptions either about income or spending are called for.
Your annual budget (Column O) will not change throughout the year.
Variance. Column P shows the difference between the budgeted expenses (Column O) and the sum of (a) monthly results and (b) projections for the remaining months of the fiscal year. This provides an early warning for when budgeted amounts are likely to be exceeded.
Some organizations use a rolling 12 month calendar, to make sure that spending decisions are supported over the longer run with expected revenue.
If you have questions or comments, please contact me at gary@ggmnonprofitconsulting.com. I will respond directly and update this post.
An Important warning: You are welcome to use and adapt the worksheet for your own purposes but ggm Nonprofit Consulting is not responsible for any errors or inaccuracies either in the sheet as provided here or that may arise from your use of it. The formulas used in the sheet may or may not work as intended. As you enter your own information into the sheet, it is very likely that formulas will shift creating inaccurate results. ALWAYS, verify results to make sure that the sheet is generating accurate results.


